Quick Look
- The Future Outlook table helps you understand if your current level of savings puts you on track to meet your retirement goals.
- The Future Outlook table shades in values that meet your low, medium, and high nest egg needs numbers.
- As your income and expenses grow, your nest egg needs numbers will too. But your nest egg need will always be up to date in today’s dollars if you were to retire today with your current lifestyle.
- View the example scenario below to track a hypothetical person’s use of the retirement planner over the course of her life.
Your life will change. Your retirement plan should too.
If you’ve used a retirement calculator in the past, there’s a good chance your experience went something like this:
You enter a few basic fields of data. It’s easy. Then, you’re asked more complicated questions. You scratch your head. “Are they asking for how much I make now, or how much I’ll make in the future? Should that be in today’s dollars or future dollars? What are ‘today’s dollars’ anyway?” You make a half-hearted attempt at reading the fine print and quickly put in your best guess. Finally, the calculator spits out some numbers. Your first reaction is, “What the…can this be right?” This is shortly followed by, “I’m never going to meet my goals.” You walk away with a mixture of discouragement and confusion.
This is a bad experience. It’s a one time exercise that provides you with some numbers. While these numbers may be mathematically correct, they provide very little context to help you take meaningful action. And if you don’t take meaningful action, you’re unlikely to achieve your goals.
Here’s the thing: Retirement planning isn’t a one time exercise. Planning for retirement takes years or several decades. And over that timeframe your life will change, probably drastically. This doesn’t mean you shouldn’t plan. But it does mean you need a plan that provides actionable information today, and that adapts with your changing life over time. The MoneySwell Retirement Planner does exactly that.
Set Annual Goals and Move Your Own Goalposts
The Retirement Planner answers two of the most important questions in retirement planning:
- In today’s dollars, how much might I need to retire? (Another way this can be read is, “If I were to retire today, given my current income and spending habits, how much would I need?”)
- Am I currently saving enough to meet my goals within my desired timeframe?
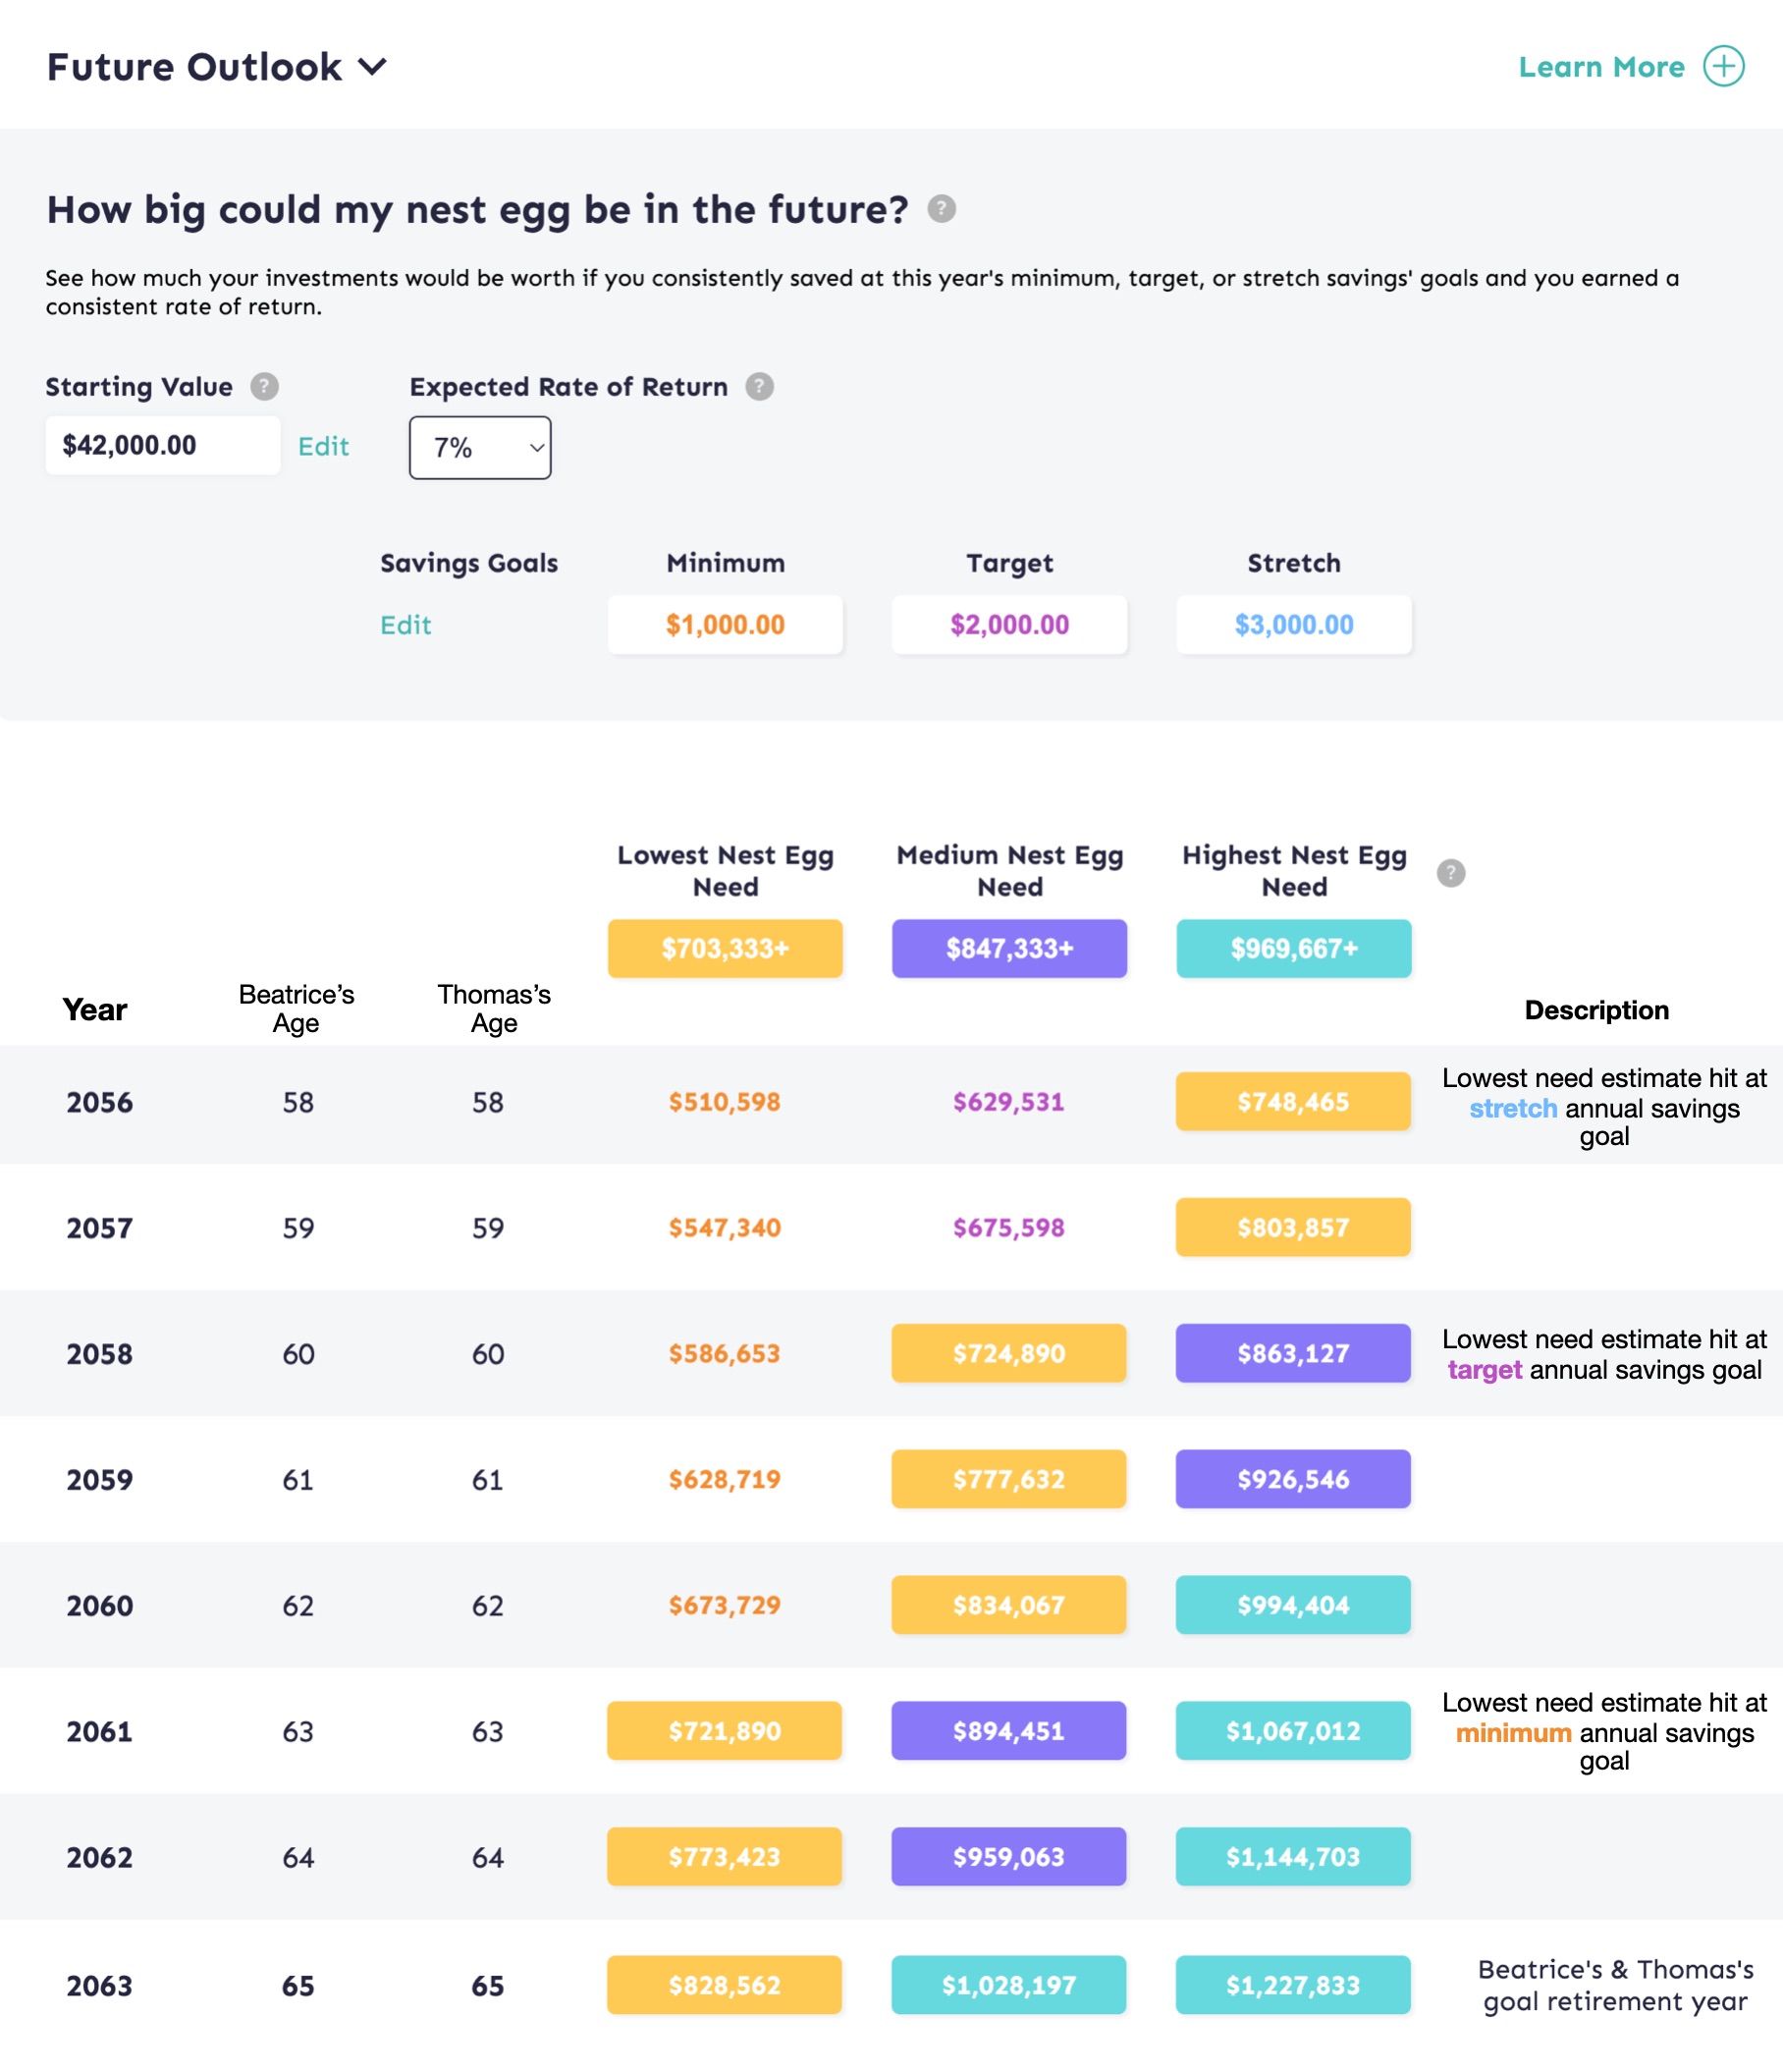
If Beatrice saves at her stretch savings goal every year, she may hit her (current estimate) lowest nest egg need as early as 58. Saving at her minimum goal may get her there by 63. But remember, her nest egg needs estimates are likely to change over time, as will her savings goals. Try it yourself!
When you set your three savings benchmarks for the year, the Future Outlook table tells you, “If you save at one of these levels this year, and every year in the future, you could have this much money at these ages.” Then, the Nest Egg Needs shading overlaps this table. The shading indicates when you will hit your Lowest, Medium, and Highest Nest Egg Needs targets.
If you’ve just gone through the exercise and discovered that at your current savings level you are not on track, don’t be discouraged. Very few people will be on track at every stage of their lives. Sometimes, you may not be on track due to your ability to save. Other times, you may be off track primarily because your nest egg needs numbers (your goalposts) have grown. However, by setting annual goals and tracking your progress, you can make adjustments as needed and feel confident you are moving in the right direction.
Examples
Let’s make sense of this by walking through an example at four stages of life. We’ll follow ‘Beatrice’ from her early twenties into her peak saving years to show you how she uses the tool to help her achieve her goals.
Remember: Depending on your circumstances, or where you are in your financial journey, the numbers below may not align with your experience. But the numbers aren’t what matters. The goal is to help you understand how to think about this tool so you can maximize its value for you.
Related Videos
Retirement Planner Overview
Step 1: My Retirement Info
Step 2: Track Retirement Goals & Progress
Step 3: Your Retirement Summary
Phase 1: Early Adulthood
Life Scenario
Beatrice landed her first salaried position this year. After taxes, her annual net income is about $36,000. She’s still in the process of paying off student loans. Combined with her other expenses and putting some money toward an emergency fund, she thinks she’ll be able to save between $1,000 and $3,000 toward retirement this year.
Future Projection
Beatrice scrolls in the Future Outlook table and sees her results. She realizes that if she were to only save at her minimum savings amount from this year forward, she wouldn’t hit her lowest nest egg goal until she was about 84 years old. This is initially discouraging but she knows she’ll probably be able to save more in future years. Then, when she looks at her pace with her target savings goal, she sees that she could hit her minimum goal by the time she’s 72. This still isn’t ideal (she’d like to retire before then) but it’s closer. Finally, she reviews her stretch savings goal. At this rate, she could hit her lowest nest egg goal by 68.
| Age | 25 |
| Current Retirement Savings | $0 |
| Annual Gross Income | $45,000 |
| Annual Spending (including debts) | $35,000 |
| Annual Savings Goals (and % of gross salary) |
|
| Current Projected Nest Egg Needs These are largely based on Beatrice’s current gross income and spending habits. As her income and expenses change, she knows her nest egg needs will likely change too. |
|
Phase 2: Early Middle Age
Life Scenario
Over the last decade of her life, Beatrice has been able to significantly increase her annual income. After taxes, her annual net income is about $66,500. She thinks she’ll be able to save between $7,500 and $14,000 (~8.3% – 15.6% of her gross income) toward retirement this year.
Future Projection
As Beatrice scrolls through the Future Outlook table, she’s pleased to see that she’s made solid progress toward her goals. At this year’s minimum savings amount, she might hit her lowest nest egg goal by age 66. At her target savings amount, she might hit that same goal by age 64, and at her stretch amount, she might hit that goal by age 60.
| Age | 35 |
| Current Retirement Savings | $79,273 – she achieved this by – on average – saving $458 per month ($5,500 per year) between the ages of 25 and 35, and earning a 7% annualized return on her investments. |
| Annual Gross Income | $90,000 |
| Annual Spending (including debts) | $54,000 |
| Annual Savings Goals (and % of gross salary) |
|
| Current Projected Nest Egg Needs As her income and expenses increased, so did the projections for what she would need in retirement. |
|
Phase 3: Middle Age
Life Scenario
Life got expensive over the last decade! Between having a child and upgrading her housing, Beatrice now spends a larger percentage of her net income, which is about $86,000. So while she’s earning more, she hasn’t been able to increase the percentage of her gross income that she save compared to a decade ago. She thinks she’ll be able to save between $10,000 and $18,000 (~8.3% – 15.0% of her gross income) toward retirement this year.
Future Projection
As Beatrice scrolls through the Future Outlook table, she notices her timeframes have changed. Unfortunately, they’re a little higher than they were before. At this year’s minimum savings amount, she might hit her lowest nest egg goal by age 67. At her target savings amount, she might hit that same goal by age 65, and at her stretch amount, she might hit that goal by age 64.
| Age | 45 |
| Current Retirement Savings | $318,031 – she achieved this by – on average – saving $917 per month ($11,000 per year) between the ages of 35 and 45, and earning about a 7% annualized return on her investments. |
| Annual Gross Income | $120,000 |
| Annual Spending (including debts) | $76,000 |
| Annual Savings Goals (and % of gross salary) |
|
| Current Projected Nest Egg Needs Again, as her income and expenses increased, so did the projections for what she would need in retirement. |
|
Phase 4: Peak Saving Years
Life Scenario
In the last decade, Beatrice has been promoted multiple times at work and increased her income. Just as importantly, she’s done a good job of not letting her expenses increase too much. Her net income is about $102,200 now. She thinks she’ll be able to save between $16,000 and $25,000 (~11.0% – 17.2% of her gross income) toward retirement this year.
Future Projection
As Beatrice scrolls through the Future Outlook table, she notices she’s made progress on her timelines, but not as much as she would like. At this year’s minimum savings amount, she might hit her lowest nest egg goal by age 66. If she saves at her target savings amount, she might hit that goal also at age 66 (but earlier in the year). Finally, at her stretch savings goal, she may hit her lowest nest egg goal by age 65.
However, now that Beatrice is closer to retirement, she’s willing to factor in other retirement income, like Social Security. She goes to ssa.gov to find her estimated Social Security income and discovers she can expect about $2,100 per month.
Now that the MoneySwell Retirement planner knows she will have other sources of income beyond her Nest Egg, it calculates that her Nest Egg doesn’t need to be as high. It now projects she may only need between about $1.6M and $2.1M.
Based on these new needs numbers, she sees that at her current savings goals, she may hit her lowest nest egg need goal between 62 and 63 and her highest nest egg need goal between 66 and 67.
| Age | 55 |
| Current Retirement Savings | $869,857 – she achieved this by – on average – saving $1,333 per month ($16,000 per year) between the ages of 45 and 55, and earning about a 7% annualized return on her investments. |
| Annual Gross Income | $145,000 |
| Annual Spending (including debts) | $79,000 |
| Annual Savings Goals (and % of gross salary) |
|
| Current Projected Nest Egg Needs Again, as her income and expenses increased, so did the projections for what she would need in retirement.However, if she factors in her estimated Social Security Income of $2,100 per month, her projected nest egg needs are lower. |
Without Additional Income
With Social Security Income Factored In
|
Summary
The examples above are overly simplified. The steady 7% annual rate of return will not be so steady in reality. (But the hope is that you can average something close to this return over the decades.) Additionally, your income may go up significantly faster or slower than Beatrice’s did. (Or you may decide to take a pay cut for a more satisfying job.)
While income that grows slower (or drops) will affect your ability to save, it also means your nest egg needs will likely be lower. This is because projections for what a person will spend in retirement are based in part on income before retirement. (You can learn more about how your nest egg needs are calculated here.)
As we’ve said before, the best time to start saving for retirement was yesterday. But the next best time is today. The MoneySwell Retirement Planner can be a helpful tool to ensure you’re doing what you reasonably can to stay on track.